Monday 31 October 2016

5 Top Performance and Capacity Concerns for VMware - Cluster Trending.

I tend to trend on Clusters the most.
VMs and Resource Pools have soft limits so they are the easiest and quickest to change.
Want to know when you’ll run out of capacity?

       The hardware is the limit

       Trend hardware utilization

The graph below shows a trend on 5 minute data for average CPU and shows a nice flat trend.


If I take the same data and trend on the peak hour then I see a difference.


You can see that the trend has a steady increase, the peaks are getting larger.

When trending ensure that you trend to cope with the peaks, to deliver immediate value, as these are what you will need to deal with.
Aggregating the Data

Next let’s look at aggregating the data. Previously we looked at Ready Time and as I said Ready Time is accumulated against a virtual machine but you can aggregate this data to see what is going on in the Cluster as a whole.
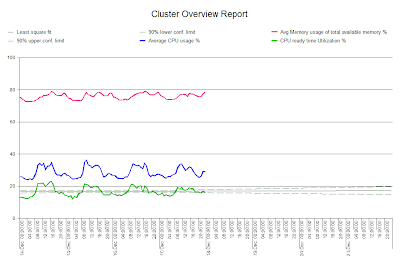
In the example below CPU utilization is not that busy but there is a steady increase in Ready Time.


The dynamic may be changing and new VM’s that are being created have more CPU’s, which could eventually cause a problem.
I hope you've enjoyed the series and for more VMware white papers and on-demand webinars join our Community and get free access to some great resources.
http://www.metron-athene.com/_resources/login.asp
Phil Bell
Consultant


Friday 28 October 2016

5 Top Performance and Capacity Concerns for VMware - Storage Latency

As I said on Wednesday if it isn’t memory that people are talking to us about then it is storage.

Again, it's not advisable to look at kb per second or I/O at the OS. As previously outlined time slicing can skew these figures so it's better to look at these from VMware.
In terms of latency there is a lot more detail in VMware. You can look at latency from the device and from the kernel.
Kernel

The graph below looks at the individual CPU’s on the hosts.


You might ask why am I looking at CPU? If there is a spike in latency on the kernel side it is worthwhile to look at CPU on processor 0. ESX runs certain processes on Processor 0 and this can have an impact on anything going through that kernel.
Latency
It is worthwhile to look at:
       Device latency
       Kernal latency
       Total latency


Shown on the graph above.

On Monday I'll conclude my series with a look at Cluster Trending. Take a look at our VMware workshop running in December http://www.metron-athene.com/services/online-workshops/capacity-management-workshops.html#vmwarevsphere

Phil Bell
Consultant

Wednesday 26 October 2016

5 Top Performance and Capacity Concerns for VMware - Cluster Memory


As I mentioned on Monday the next place to look at for memory issues is at the Cluster.

It is useful to look at:

       Average memory usage of total memory available

       Average amount of memory used by memory control

       Average memory shared across the VM’s

       Average swap space in use

In the graph below we can see that when the shared memory drops the individual memory usage increases.


In addition to that swapping and memory control increased at the same time.
If it isn’t memory that people are talking to us about then it's storage and that's what we'll take a look at on Friday.
Phil Bell
Consultant

Monday 24 October 2016

5 Top Performance and Capacity Concerns for VMware - Monitoring Memory

Memory still seems to be the item that prompts most upgrades, with VM’s running out of memory before running out of vCPU.

It’s not just a question of how much of it is being used as there are different ways of monitoring it. Some of the things that you are going to need to consider are:

       Reservations

       Limits

       Ballooning

       Shared Pages

       Active Memory

       Memory Available for VMs

VM Memory Occupancy

In terms of occupancy the sorts of things that you will want to look at are:

       Average Memory overhead

       Average Memory used by the VM(active memory)

       Average Memory shared

       Average amount of host memory consumed by the VM

       Average memory granted to the VM


In this instance we can see that the pink area is active memory and we can note that the average amount of host memory used by this VM increases at certain points in the chart.
VM Memory Performance
It's useful to produce a performance graph for memory where you can compare:
       Average memory reclaimed
       Average memory swapped
       Memory limit
       Memory reservation
       Average amount of host memory consumed.
As illustrated below.


In this instance we can see that this particular VM had around 2.5gb of memory ‘stolen’ from it by the balloon driver (vmmemctrl), at the same time swapping was occurring and this could cause performance problems.
The next place to look at for memory issues is at the Cluster and I'll deal with this on Wednesday.
In the meantime don't forget to book your place on our VMware vSphere Capacity & Performance Essentials workshop taking place in December http://www.metron-athene.com/services/online-workshops/index.html
Phil Bell
Consultant

Friday 14 October 2016

5 Top Performance and Capacity Concerns for VMware - Ready Time

As I mentioned on Wednesday there are 3 states which the VM can be in:


Threads – being processed and allocated to a thread.

Ready – in a ready state where they wish to process but aren’t able to.

Idle – where they exist but don’t need to be doing anything at this time.
In the diagram below you can see that work has moved over the threads to be processed and there is some available headroom. Work that is waiting to be processed requires 2 CPU’s so is unable to fit and creates wasted space that we are unable to use at this time.


We need to remove a VM before we can put a 2 CPU VM on to a thread and remain 100% busy.

In the meantime other VM’s are coming along and we now have a 4vCPU VM accumulating Ready Time.

2 VM’s moves off but the 4vCPU VM waiting cannot move on as there are not enough vCPU’s available.


It has to wait and other work moves ahead of it to process.


Even when 3vCPU’s are available it is still unable to process and will be ‘queue jumped’ by other VM’s who require less vCPU’s.


Hopefully that is a clear illustration of why it makes sense to reduce contention by having as few vCPUs as possible in each VM.
Ready Time impacts on performance and needs to be monitored. On Monday I'll be dealing with Monitoring Memory.
Phil Bell
Consultant

Wednesday 12 October 2016

5 Top Performance and Capacity Concerns for VMware - Ready Time

Imagine you are driving a car, and you are stationary, there could be several reasons for this.  You may be waiting to pick someone up, you may have stopped to take a phone call, or it might be that you have stopped at a red light.  The first two of these (pick up, phone) you have decided to stop the car to perform a task.  In the third instance the red light is stopping you doing something you want to do.  In fact you spend the whole time at the red light ready to move away as soon as the light turns to green.  That time is ready time.

When a VM wants to use the processor, but is stopped from doing so.  It accumulates ready time and this has a direct impact on performance.
For any processing to happen all the vCPUs assigned to the VM must be running at the same time.  This means if you have a 4 vCPU all 4 need available cores or hyperthreads to run.  So the fewer vCPUs a VM has, the more likely it is to be able to get onto the processors. 

To avoid Ready Time
You can reduce contention by having as few vCPUs as possible in each VM.  If you monitor CPU Threads, vCPUs and Ready Time you’ll be able to see if there is a correlation between increasing vCPU numbers and Ready Time in your systems.

Proportion of Time: 4 vCPU VM
Below is an example of a 4vCPU VM, each doing about 500 seconds worth of real CPU time and about a 1000’s worth of Ready Time.


For every 1 second of processing the VM is waiting around 2 seconds to process, so it’s spending almost twice as long to process than it is processing. This is going to impact on the performance being experienced by the end user who is reliant on this VM.

Now let’s compare that to the proportion of time spent processing on a 2 vCPU VM. The graph below shows a 2 vCPU VM doing the same amount of work, around 500
seconds worth of real CPU time and as you can see the Ready Time is significantly less.


There are 3 states which the VM can be in and we'll take a look at these on Friday.
Don't forget to book on to our VMware vSphere Capacity & Performance Essentials workshop starting on Dec 6 http://www.metron-athene.com/services/online-workshops/index.html
Phil Bell
Consultant

Monday 10 October 2016

5 Top Performance and Capacity Concerns for VMware - Time Slicing

As I mentioned on Friday the large difference between what the OS thinks is happening and what is really happening all comes down to time slicing.

In a typical VMware host we have more vCPUs assigned to VMs than we do physical cores. 
The processing time of the cores has to be shared among the vCPUs. Cores are shared between vCPUs in time slices, 1 vCPU to 1 core at any point in time.
More vCPUs lead to more time slicing. The more vCPUs we have the less time each can be on the core, and therefore the slower time passes for that VM.  To keep the VM in time extra time interrupts are sent in quick succession.  So time passes slowly and then very fast.


More time slicing equals less accurate data from the OS.
Anything that doesn’t relate to time, such as disc occupancy should be ok to use.
On Wednesday I'll be dealing with Ready Time, you've still got time to register to come along to my webinar 'VMware and Hyper-V Virtualization over-subscription(What's so scary?) taking place on October 12. http://www.metron-athene.com/services/webinars/index.html
Phil Bell
Consultant

Friday 7 October 2016

5 Top Performance and Capacity Concerns for VMware


I'll be hosting our webinar VMware and Hyper-V Virtualization Over-Subscription (What's so scary?) on October 12 http://www.metron-athene.com/services/webinars/index.html so I thought it would be pertinent to take a look at the Top 5 Performance and Capacity Concerns for VMware in my blog series.

I’ll begin with Dangers with OS Metrics.

Almost every time we discuss data capture for VMware, we’ll be asked by someone if we can capture the utilization of specific VMs, by monitoring the OS.  The simple answer is no.

In the example below the operating system sees that VM1 is busy 50% of the time but VMware sees is that it was only there for half of half the time and accordingly reports that it is 25% busy.
Looking at the second VM running, VM2, both the operating systems and VMware are in accordance that it is in full use and report that it is 50% busy.
This is a good example of the disparity that can sometimes occur.
OS vs VMware data
Here is data from a real VM. 

The (top) dark blue line is the data captured from the OS, and the (Bottom) light blue line is the data from VMware.  While there clearly is some correlation between the two, at the start of the chart there is about 1.5% CPU difference.  Given we’re only running at about 4.5% CPU that is an overestimation by the OS of about 35%.  While at about 09:00 the difference is ~0.5% so the difference doesn’t remain stable either.  This is a small system but if you scaled this up it would not be unusual to see the OS reporting 70% CPU utilisation and VMware reporting 30%.
This large difference between what the OS thinks is happening and what is really happening all comes down to time slicing.
I'll be looking at time slicing on Monday.

Phil Bell
Consultant